Australian Journal of Management: Solving the paradox of Lean Management’s low success rate
Abstract
This study investigates problems related to the high variance in the success rate of lean implementations, using a unique data set from a specific approach to implementing lean. We develop insights about how to effectively resolve the ‘Lean paradox’, namely that Lean concepts promise so much in theory yet deliver infrequently in practice. Our primary data of 268 Lean implementation initiatives illuminates the core elements of lean implementation success that explain this success variance. We present an in-depth case study of that specific method of lean implementation. Lean implementation success occurs when specific processes are followed, namely integration of job role and process analysis, comprehensive end-to-end deployment rather than spot-based problem solving, use of operator-based data about processes and waste, detailed level of data and change deployment focused on waste reduction, and ongoing measurement and control of process changes. These ‘how’ factors provide both conceptual and practical insights for managers.
JEL Classification: M11
1. Introduction
Lean management (LM) stems from the whole of organization production system invented by Toyota over many years. The Toyota system is used day to day to continually remove waste1 in their automotive production processes, and indeed across their organization (Samson and Swink, 2023). Since their innovation, there have been many LM implementations attempting replication. Most have demonstrated only isolated improvements and limited success rates.2 Narayanan et al. (2022) reported that
‘Overall, the study demonstrates that lean implementation as a sociotechnical system contributes to superior performance, using cross sectional data from a large sample of hospitals, however there is still much variance that is yet to be explained as to specifically how this complex sociotechnical approach works’.
This study uniquely contributes conceptually and empirically to a practical research question about LM: ‘how can the success rate of LM be improved, through more effective implementation of its concepts?’ Related to this, if practical deployment approaches can be empirically demonstrated that are highly correlated with performance success, then we should expect LM deployment rates to rise across economies, as scepticism is overcome by positive evidence of such success (Kochan and Nowicki, 2018). To achieve this, cross-sectional studies such as Narayanan et al. (2022) can be supplemented with those, such as the present study, that report on our detailed development and deployment of a specific approach to LM (labelled ‘3P’3), demonstrating not just statistical association of
‘success factors’, but bringing primary data on causality to bear, through the innovative use of intervention-based research methods.
This study was motivated by a desire to understand why and how LM has such high variance in achieving successful outcomes, ranging from full organization-wide adoption and beneficial outcomes such as in Toyota (Liker, 2004), through to the more common and frequent LM initiative that fails to accomplish any lasting change (Narayanan et al., 2022). From this, core objective motivating our research was to understand fully the factors preventing LM from achieving a whole of process optimization on a consistent basis. We set out to document these barriers. We then engaged in a large number of intervention-based research case studies, applying a new approach to deploying LM and refining that approach over more than two decades of trial and learning development.
We found that the scholarship undertaken is restricted to understanding what LM theoretically provides, or achieves at the organizational level (Narayanan et al., 2022). We found a dearth of comprehensive, empirical evidence of the testing of the deployment methods used, by opening the ‘black box’ and examining not just what ‘practice’ factors are reported (in surveys) but specifically how they cause improvement of outcomes. A recent contribution by Januszek et al. (2023: 401) found that ‘When management engages in performance measurement, visualisation and employee empowerment the relationship between hard lean practices and performance is positively moderated. On the other hand, when managers emphasise goal setting and work standardisation the performance outcomes are reduced’. This article contributes to fill this gap, as its findings are based on a large number of intervention-based research initiatives developed and refined over decades, as outlined in the methodology section. Our study follows research such as Januszek’s and indeed goes deeper than a cross-sectional survey method can, through deeply immersed researcher involvement in hundreds of Lean Management interventions.
Considering the adage: ‘Ideas are cheap, implementation is everything’, we can understand how and why such powerful concepts as those of LM have had relatively low success rates in practice. The paradox of LM implementation has been the chasm between the ‘quality’ of LM concepts which is high, and the poor quality of organized efforts to make LM initiatives stick, work and deliver. In practical terms, while it is difficult to argue against the powerful ideas of LM such as ‘identify then eliminate all forms of waste’,4 this is clearly and commonly easier to say than to get done. Over some 25 years, we have developed and evidenced a set of robust methods that resolves this LM implementation paradox. This paradox, by which we mean a contradictory set of ideas or propositions, is that LM is used in the field of operations management to simplify processes, remove waste and unnecessary complexity and focus on conducting value-adding activities only, through ‘getting it right the first time, every time’, yet attempts to implement LM in organizations are themselves usually wasteful and do not ‘get it right’ (Narayanan et al., 2022).
In searching for a more holistic and science-based approach to Operations Management, Spearman and Hopp (2021) described that Lean (other than in Toyota), and Six sigma have achieved ‘. . . very mixed success. . . Simplistic mottos such as ‘drain the water to see the rocks’, ‘do only what creates value for the customer’, and “deliver just in time”, are poor substitutes for clear principles and intuition’. Spearman and Hopp (2021: 806) further describe Lean:
‘For example, the Lean Institute defines the Five Principles of Lean as: 1. Identify value. 2. Map the value stream. 3. Create flow. 4. Establish pull. 5. Seek perfection. Obviously, there are no testable hypotheses inherent in the way these are stated. They sound like religious commandments. Indeed, Lean is sometimes presented as a philosophical or almost religious framework of beliefs’.
We agree, in the sense that such high-level prescriptions are non-scientific but intuitively attractive ideas (somewhat like ‘commandments’), leaving the user/implementor ample scope to deploy such ideals well, or poorly.
Others such as Benassi (2024) have examined how Lean Management works in different countries using a societal-focussed approach, which is quite at variance with that of Spearman and Hopp (2021) as expressed above. Another recent study by Kunnen et al. (2023) focussed on healthcare organizations reviewed 52 mostly empirical examinations of Lean Management barriers and facilitators factors, determining that most such factors were related to managerial settings and not the effectiveness or lack of such in deploying the tools and techniques of lean methods. Delving further into healthcare uses of lean, Sales-Coll et al. (2023) used intervention-based research and found that surgery process could be significantly improved by using lean techniques.
Soliman and Saurin (2022) have acknowledged the significant gap between ‘Lean-as-Imagined (LAI) in design and Lean-as-Done (LAD) in practice’. This observation goes to the heart of how and why LM has had relatively low success rates in practice, since their explanation of lean depicts the complexity of sociotechnical systems and challenging organizational circumstances in which LM is often deployed. Our study responds to Soliman and Saurin’s (2022) call for future research and addresses that sociotechnical complexity factor as key to resolving the LM theory–practice gap, being primarily due to the complexity of real-world sociotechnical elements, as compared with the proposed conceptual use of lean as a set of tactical tools. Soliman and Saurin’s approach successfully used a detailed case study to show that a ‘tools and techniques’ approach to LM is insufficient, and this evidence provides the basis for resolving the paradox referred to above, through developing and testing an approach that fully and explicitly accounts for the socio-elements of LM, as well as the technical tools application.
In summary, we were motivated to delve much deeper than to accept what Spearman and Hopp (2021) referred to as ‘almost religious’, ‘commandments’, with ‘no testable hypotheses’ through deeply, repeatedly and thoroughly deploying LM, to obtain a large set of primary data through hands-on intervention-based methods.
2. Literature review
LM owes its origins to understanding the Toyota Production System (Holweg, 2007). Its concepts were disseminated outside of Japan in the seminal work ‘The Machine That Changed the World’ (Womack et al. (1990). LM has since been widely used in attempts to reduce waste and improve process efficiency, quality, lead-time, and competitiveness (Moyano-Fuentes and Sacristán-Díaz, 2012).
LM can be defined as ‘an integrated socio-technical system whose main objective is to eliminate waste by concurrently reducing or minimizing supplier, customer, and internal variability’ (Shah and Ward, 2007). Its overall objective is to reduce fluctuations in order to increase customer value by identifying and removing non-value-adding activities (Staats et al., 2011; Womack and Jones, 2013). One way to achieve this is by reducing the size of the often-visible interstage buffers. This is achieved by making trade-offs between inventory, capacity and time (Hopp and Spearman, 2004; Yin et al., 2017). Finally, LM is implemented to enhance capacity exploitation and diminish inventories through minimizing system variability (De Treville and Antonakis, 2006). Yet, as recently described by Spearman and Hopp (2021), there are still multiple definitions and ‘lenses’ associated with what is Lean practice in operations management, and hence how it should be approached and implemented, leading to lean often being implemented by ‘trial-and-error experience’ in an incomplete way, for example, by ignoring or undermanaging the social/cultural lens. Lean management systems are important as part of modern approaches to operations management and hence business competitiveness (Sergei et al. 2023), especially in the present era that is characterized by relatively frequent yet unpredictable supply chain disruptions (Feng et al., 2022).
Successful lean implementation can lead to both financial and non-financial benefits (Bhamu and Singh Sangwan, 2014; Fullerton et al., 2014). These benefits include reduced costs and decision failures, and improved quality, lead time, inventory, employee morale and communication (Emiliani, 2006; Fullerton et al., 2014; Fullerton and Wempe, 2009; Moyano-Fuentes and Sacristán-Díaz, 2012). Understanding both the strategic and operational needs is a prerequisite (Hines et al., 2004). In theory, LM promises much, and in cases such as Toyota, it has delivered well in a range of circumstances (Samson and Swink, 2023). Most recently, when much of the world has experienced shortages due to supply chain disruptions in the COVID-19 period, Graves et al. (2022) have asserted and justified that ‘Lean was not the culprit’, since Lean is indeed based on strong responsiveness to environmental changes.
2.1. LM in practice
While the promised benefits of LM are compelling, high failures of lean approaches are reported (Belekoukias et al., 2014; Bevilacqua et al., 2017; Panizzolo et al., 2012; Pay, 2008). Observations consistently reveal low rates of effective, sustainable benefits (Bhasin and Burcher, 2006; Hines et al., 2004; Holweg, 2007). Short-term benefits are achieved (Jasti and Kodali, 2015) and are generally localized (Bhamu and Singh Sangwan, 2014; Bhasin and Burcher, 2006). Long-term advantage often remains elusive.
The conclusion is that LM has most often been used to solve ‘spot’ problems, such as single bottlenecks. Consequently, maintaining a long-term, process-wide lean philosophy is an unfulfilled challenge. This gap has been attributed to limited real-world tested frameworks (Jasti and Kodali, 2015), lengthy implementation times and limitations of traditional LM tools, techniques and methodologies. Further, the ‘socio’ aspect of this required sociotechnical system, particularly the shop-floor behavioural aspects of change are undermanaged (Bhamu and Singh Sangwan, 2014).
Sociotechnical theory continues to be applied to how organizations make changes and improvements work effectively, and this paradigm provides the key lens for viewing the gap between theory and practice: sociotechnical theory would suggest that the human aspects of LM are important and needed for LM implementation success and that the variance in emphasis of the socio-aspect of change management is an explanatory element of the variance in that set of (LM success) outcomes. Supporting evidence comes even from the relatively new world of digitalisation and Industry 4.0 technologies, whereby recent work has highlighted the importance of taking a sociotechnical approach (Sony and Naik, 2020), even when technological intensity is high. It was from this theoretical frame that this study of a fully sociotechnical approach to LM was created: and the practical field testing to determine how it would overcome the traditional LM difficulties referred to in the literature is outlined in the sections below.
This sociotechnical theoretic approach framed the research questions about the efficiency and sustainability of the traditional LM deployment approach. A systematic mechanism for organization-wide LM solution development and deployment is a major practical and theoretical operations management need.
2.2. LM implementation difficulties
The three important practical problems of the low rate of successful lean implementation (Bhasin and Burcher, 2006) and localization (Bhamu and Singh Sangwan, 2014; Bhasin and Burcher, 2006) can be distilled down to a number of barriers. We summarize these below:
First, there is an inadequate appreciation of the need for an organization-wide LM system (Anand and Kodali, 2010). Organizations instead opportunistically implement ‘bits and pieces’ of lean practice ignoring the importance of deeper, organization-wide (end-to-end process) implementation (Hines et al., 2004; Holweg, 2007; Pettersen, 2009). Several studies have found that firms fail to attain and maintain a long-term lean philosophy (Bortolotti et al., 2015; Hopp, 2018; Jasti and Kodali, 2015; Liker and Rother, 2011; Schonberger, 2007).
Second, while lean practices have been classified into hard and soft components (Bortolotti et al., 2015; Fotopoulos and Psomas, 2009; Rahman and Bullock, 2005; Samson and Terziovski, 1999; Shah and Ward, 2007), the soft (people) component has not been equally or sufficiently emphasized by managers (Liker, 2004; Liker and Rother, 2011). Surveys consistently show that the most common reasons behind failed lean implementation are ‘lack of commitment from top managers’, ‘resistance to change’ and ‘over-reliance on tools’ (Hopp, 2018). Arguably, this is associated with a lack of management and shop floor engagement in deployment efforts.
Third, LM deployment methods used do not seem to have been systematically lean in themselves. The focus on isolated improvements is a ‘non-systems’ approach. It took Toyota decades to widely implement lean practices across its production and management systems. Direct observation over multiple years by one of the authors witnessed Toyota conducting a ‘full court press’ on lean practices every day (Samson and Swink, 2023). It has therefore applied core pillars of Respect for People, and Continuous Improvement which enable change adjustments uncovered by one team to be welcomed and deployed in another. Toyota sincerely and effectively integrates the ‘soft’ and ‘hard’ lean elements. In contrast, many firms looking to use LM as a ‘silver bullet’ to solve their operational problems are disappointed because of the absence of an organization-wide LM system.
Fourth, most research has addressed lean by taking the conceptual approach of specifying its component elements, with few attempts towards empirically examining the proposed deployment models and frameworks holistically required in real-world environments. While various LM frameworks have been proposed (Karlsson and Åhlström, 1996; Pettersen, 2009; Zhu et al., 1994), the deployment status for these frameworks has not yet been examined. Furthermore, there is little research directed at measuring the actual performance of the proposed frameworks in organizations. This has been referred to as one of the fundamental challenges of empirically demonstrating lean as a successful practice (Jasti and Kodali, 2015; Shah and Ward, 2003; Stone, 2012). Finally, academic research on LM has extensively relied on questionnaires as a tool to investigate proposed frameworks and techniques. There has been very limited attention directed at exploring real-world observations and case study outcomes (Vamsi Krishna Jasti and Kodali, 2014). An exception is Netland et al. (2015), who found that ‘bottom-up focus’ can support Lean success. Their study from a single firm found the importance of shop floor emphasis on lean implementation success, and the present study responds to their call for multi-firm studies of these phenomena. Riege and Zulpo (2007) point to the importance of the detailed knowledge of shop floor employees.
Finally, most of the research has been in a manufacturing environment using industry-specific concepts and terminology. Whereas waste is clearly more easily observed in manufacturing industries such as through defective products or components, it is much less easily visible in support processes or services production (Dinis-Carvalho and Fernandes, 2017).
3. Methodology: qualitative and intervention-based research
Our research process proceeded over some 20 years, overarchingly being Intervention-Based Research, and within and related to that, qualitative research interviews and archival file examination. Intervention-Based Research has only quite recently become fully and explicitly recognized and formally legitimized in management and particularly operations management fields of research, as in the newly established department in the premier research journal, Journal of Operations Management (Chandrasekaran et al., 2023). We used a novel approach which meets the criteria outlined in the Design Science inspired approach (e.g. Akkermans et al., 2019; Friesike et al., 2019; Groop et al., 2017; Johnson et al., 2020) that has evolved into the Intervention-Based Research method, as comprehensively described in Chandrasekaran et al. (2023). We note that while intervention research is relatively new as a scholarly research method in operations management, its roots come from organizational behaviour and human resources fields, where it has been used for some decades (Thomas and Rothman, 2013; Truxillo et al., 2015).
Our multimethod research approach adopts intervention-based research as its method, which takes the best features of action research, updates design sciences research and uses rigorous qualitative methods to allow researchers to simultaneously develop conceptual frameworks and to be closely involved in real organizational improvement, with an explicit mission of: ‘to publish high quality research articles that derive new theoretical and managerial insights by engaging with practice and solving complex field problems’. (Chandrasekaran et al., 2023).
With this study’s mission and motivation being to deeply understand the paradox surrounding LM (defined in the Introduction section), and to rigorously resolve this paradox, the requirement was to not just propose ideas or refined tools for LM but to develop and thoroughly deploy, field test and validate an approach that overcame the barriers to successful LM as identified in the literature review (see above). This work involved 268 LM interventions in organizations, through which, over 20 years, the LM deployment approach (referred to as 3P, described in detail in the Appendix) was developed and refined over many cycles.
In order to fully understand how the LM paradox was resolved through such interventions, we began by interviewing the primary inventor (Mr Tom Bevington) of the new approach, and recorded answers to trace and track the development process, which is presented as a set of findings in itself in section 4. These interviews took place regularly as the 3P approach was developed in real time, from 2010 to 2024. Findings explain how the barriers to successful LM deployment were recognized, conceptualized over time and then how solutions to overcome these barriers were baked into the Intervention-Based research method as 3P was developed and refined over decades.
A second step was to deeply investigate key interventions that used 3P, including to stretch the concepts and method to circumstances whereby processes and waste are in less tangible contexts. The third phase of this multimethod research study was to extend the archival analysis through accessing the files of the 268 cases that made use of 3P in its intervention bases, as these had become a source of secondary data for the university research team, such that through drawing on that archival data and analyzing it, more powerful determinations could be made about the validity, generalizability and overall power of the 3P approach. These 268 case studies were of Mr Bevington’s clients and ranged highly in size and sector, as presented later in this article.
Findings from those many interventions subsequently led to 10 additional workshops conducted by the research team/authors and the 3P inventor in 2021–2023, in order to crystallize and clearly conceptualize the key differences between traditional approaches to LM and the 3P approach, with as much precision as could be achieved through qualitative analysis.
The intervention-based research that was undertaken by the 3P development team in the 268 interventions, and the results from those activities were then triangulated with both the detailed interviews and discussions with the 3P founder, the analysis of the research files as secondary data, and finally the research team/founder workshops, in order to gain the clearest view possible of the distinguishing features of 3P, that explain why 3P’s success rate is so high when traditional LM so often fails.
4. Findings about 3P model5 development: A Lean deployment method
For this section of the research, we conducted a series of interviews with the key people who developed the 3P approach and present those findings herein.
We describe below the key points from the interview with the 3P inventor, followed by one detailed case study (from the 268 cases) that more deeply illustrates the 3P method, then summary results from the 268 archival case study data analyses, and more general findings.
4.1. Interviews with the 3P founder/inventor
Mr Bevington described the 3P development process in a series of interviews, summarized below.
First tentative steps: the first methodology breakthrough came in 1985 from them intuitively feeling that conventional process mapping, conducted by workshops and interviews, revealed little opportunity in a well-managed business. There were undoubtedly needs to improve, indicated by delays and mistakes. At that time, the developers were conducting a cost-driven review to define a new computer system for the downstream oil subsidiary of a large US chemicals business. The brief was to develop comprehensive process maps for the whole business, use them to validate the company procedures paying particular attention to safety/risk management and define opportunities for productivity gains as a prerequisite to specifying a new computer system.
The first finding they reported was that the mapped activities added very little value to the company procedures. The maps did link the steps into the process flows which was essential for the computer system deployment. When the staff were asked whether everything was received right-first-time, they were deluged with a plethora of undocumented routine, daily work steps. There were multiple linkages from many of these to other parts of the process map and even outside the business. There were so many undocumented items such as ‘workarounds’ that they could not be accommodated in the process maps without obliterating the main intended process flow. The first tentative step then:6
‘We realized that understanding process flows differs from documenting process waste. Documenting process flows is constrained for practical reasons to mapping the flow of a “clean” transaction through the organization(s). We did try to process map the many error rectification loops, but it was just not possible. There were hundreds of loops back through the process’.
The developers therefore looked for another mechanism to dramatically reduce elapsed time and obtain this detailed rectification data. After a number of false starts, they experimented with asking the employees themselves to make use of simple, list-type templates to document everything they did. This meant in effect taking every task in the operating manual and listing underneath the rectification steps they took when an error was found. A pattern emerged – receive, check, request information from. . ., check information subsequently received, correct or complete as necessary, etc.
‘To obtain the detail we were looking for traditionally would mean interviewing each employee in each team. This was a daunting task. So, we tried giving some training and then asked each employee to document what they did including those pertaining to each non-conforming transaction. Suddenly we had everything we had asked for in just 2 weeks or so for even huge organizations, because everyone spent a few hours working on their role in parallel.
We were worried that we would get many complaints for the extra work employees were asked to do. We need not have had concerns. They loved it. It gave them permission to document all the activities which prevented them cleanly processing. A typical comment was “At last we are looking at the real problems in this department”’.
The intense involvement and the positive reaction of the employees combined with the discriminatory nature of the data is real evidence that a sociotechnical system as required for LM was emerging. The bottom-up coding of data from frontline employees was crucial to the 3P effectiveness, because only those people who were doing the work knew the details of the waste in the process steps, and further because of the empowering impact that consulting with them had on the whole intervention, including when it later became time to formulate and implement process changes.
The next issue the developers spoke about was how to understand what the noise really was so it could be discussed and analyzed. Working through the mound of paper, common patterns were obvious. Most of the noise, the rework activity, related to incomplete or incorrect information being relayed through processes, causing errors and waste to propagate.
The ‘swim lanes’ process flow allowed employees to see where changes were needed to remove the main elements of noise which was absorbing their time and reducing service levels. It also sparked many practical change suggestions which were immediately discussed with the people in the room who were the ‘perpetrators’. The next development was to capture these ideas, link them to the spots where changes were needed such that noise elimination would then occur. Each mini-implementation plan was hyperlinked to the points at which the change was needed with the saving quantified to ready the proposals for management sign off and deployment.
‘The employees therefore develop most of the change needs so that when they are asked to implement, they know why the change is needed, what the change actually is and who will gain time from implementation. Also, and it hardly needs to be said, if the “perpetrators” don’t fix the issue as agreed, the “victim” knows who to call!’
The final step in development was defining a supportive measurement system. It was realized that every change proposal was directly linked to specific activities in a particular team. Logically therefore, information confirming that the change had been made and was ongoing and adhered to be a practical need. A whole set of practices about establishing these measures was addressed.
‘BCIs (Behavioural Change Indicators) came out of an internal meeting at which we were discussing the need for measures to guarantee implementation. We knew exactly what changes were needed and in which team they were to be applied so we could determine a measure – e.g. a check that no document was left incomplete. We therefore had both the agreed change in activities by role and a measure that the change had occurred’.
4.2. Case example of 3P application in healthcare
Australia has a very high cancer rate, and it is the leading cause of death there. The Peter MacCallum Cancer Centre (hereafter PMCC) located in Melbourne, Victoria, was established in 1949. The PMCC is a leading institution dedicated to cancer research, education and treatment. It is positioned alongside one of the largest hospitals in the country and the largest university in Australia. PMCC has over 5000 staff operating in over five sites, including more than 580 laboratory and clinical researchers locating in a $1 billion building admitting around 31,000 patients, and processing over 200,000 outpatient appointments each year.
An evident problem was a bottleneck in the process used to book and carry out the CT scan for most presenting patients. At the time the study began, it took 29 days on average to organize a scan. This was an unacceptable delay for patients with serious disease. As a result, doctors were sending scans off-site and were interrupting the in-house schedule to respond to the urgency of some cases. Patients were complaining of the wait; nurse coordinators were wasting a lot of their time, and financial resources were impacted. The problem therefore presented itself as requiring the application of a Lean programme, where the main intent was to eliminate waste and decrease variability (Shah and Ward, 2007).
The outcome was the complete elimination of the scan delay. It was reduced from 29 days to the same day. The annualized $1,000,000 spent on urgent imaging was saved. Other results, not quantified, increased the effective capacity, for example, by removing most of the 24% of waste embedded in a typical doctors’ day. Resistance to the improvements as reported by Fournier et al. (2023) was not a problem.
‘This work enabled us to capture the whole role that our staff members play in patients’ delivery of treatment to get a 360-degree view. It really enabled us to drill down on the things where we can deliver value added extras to the patient and remove things that are wasting patients time and energy’. (PMCC Chief Medical Officer, Dr. David Speakman)
How 3P maps onto the five LM steps is represented diagrammatically in Figure 1. The evaluation of the PMCC case study is presented for each of the 5 LM stages.

Figure 1. Five LM steps.
4.2.1 Define
The scope covered all roles in the Radiology and Outpatients Departments (Figure 2). Detailed data was collected by role for Administration, Nurses, Radiographers and Radiologists in Radiology and Doctors, Nurses and Clerks in Outpatients. Over 600 people were involved documenting 44 different job roles (summarized in Figure 2).
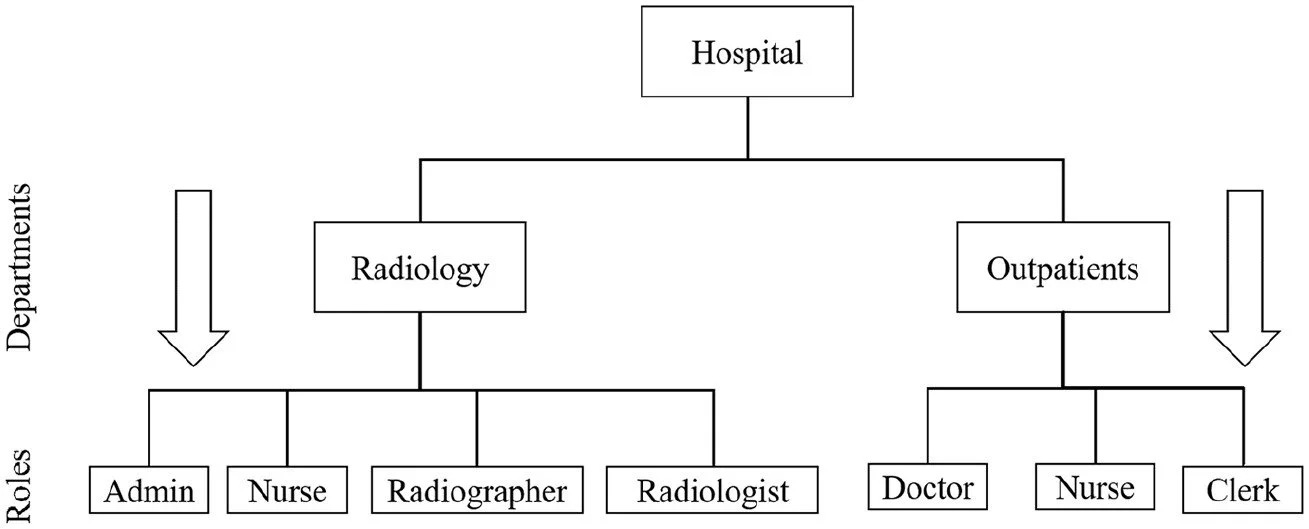
Figure 2. Scope definition.
Briefings were given to everyone involved setting out the performance issues which needed to be addressed and how everyone would be involved. Briefing sessions were enthusiastically attended although more than normal were required because they had to be fitted in around the busy work and shift patterns. Coaching sessions were held.
4.2.2 Measure
Over 7000 detailed activities were entered into the database for the 44 roles, averaging 159 activities per role. Coaching sessions were arranged to help the participants allocate their time and then identify, agree and code the Noise. The 3P software that enacts the 3P method developed by the inventor was then used to load the coded activities data into each process. A high-level summary printout of role participation in the booking process is included as Figure 3. It indicates a high level of interaction between roles and therefore fertile ground for Noise.
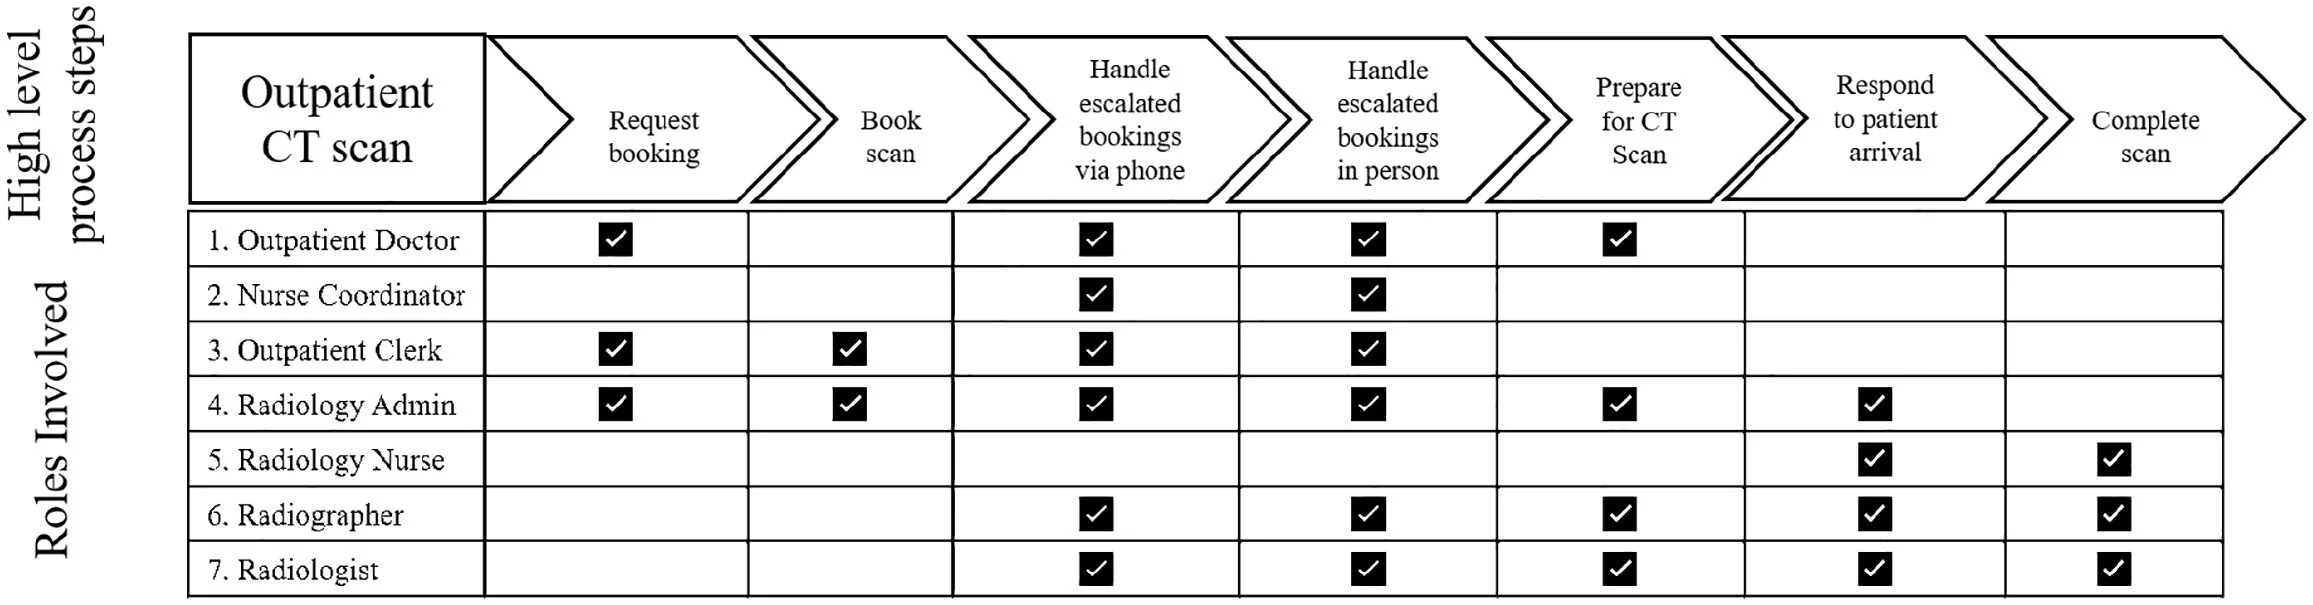
Figure 3. Process and role interaction.
An example of detailed data collected is included as Figure 4. The detailed data on the activities was coded by participants involved in the LM intervention, supported by coaches. Coding was checked by the coaches and the analysis was conducted and concluded within a single 3-month period.
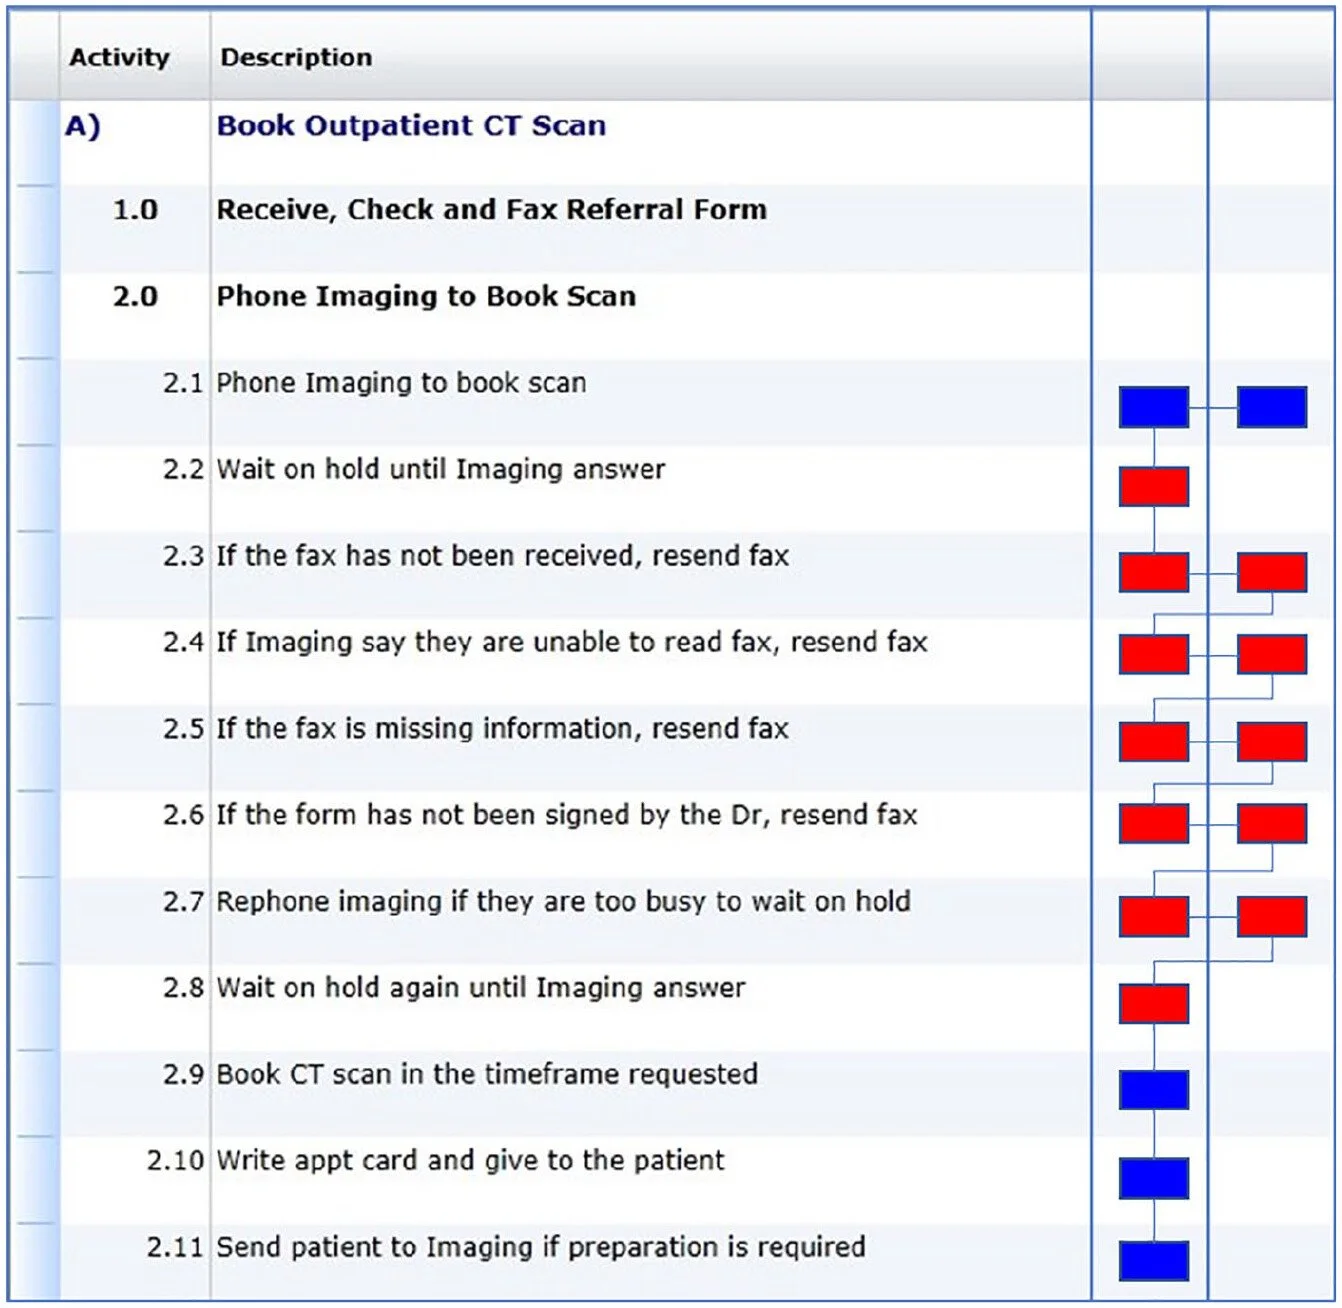
Figure 4. An example of part of the detailed data for a role.
4.2.3 Analyze
The process flow was analyzed. The noise drivers were identified by inspection and the amount of time was accumulated for each, from the coded data of the 7000 + activities and their classification as in Figure 4. Figure 5 shows the noise level in the booking process (44%) and a selection of the significant noise activities.
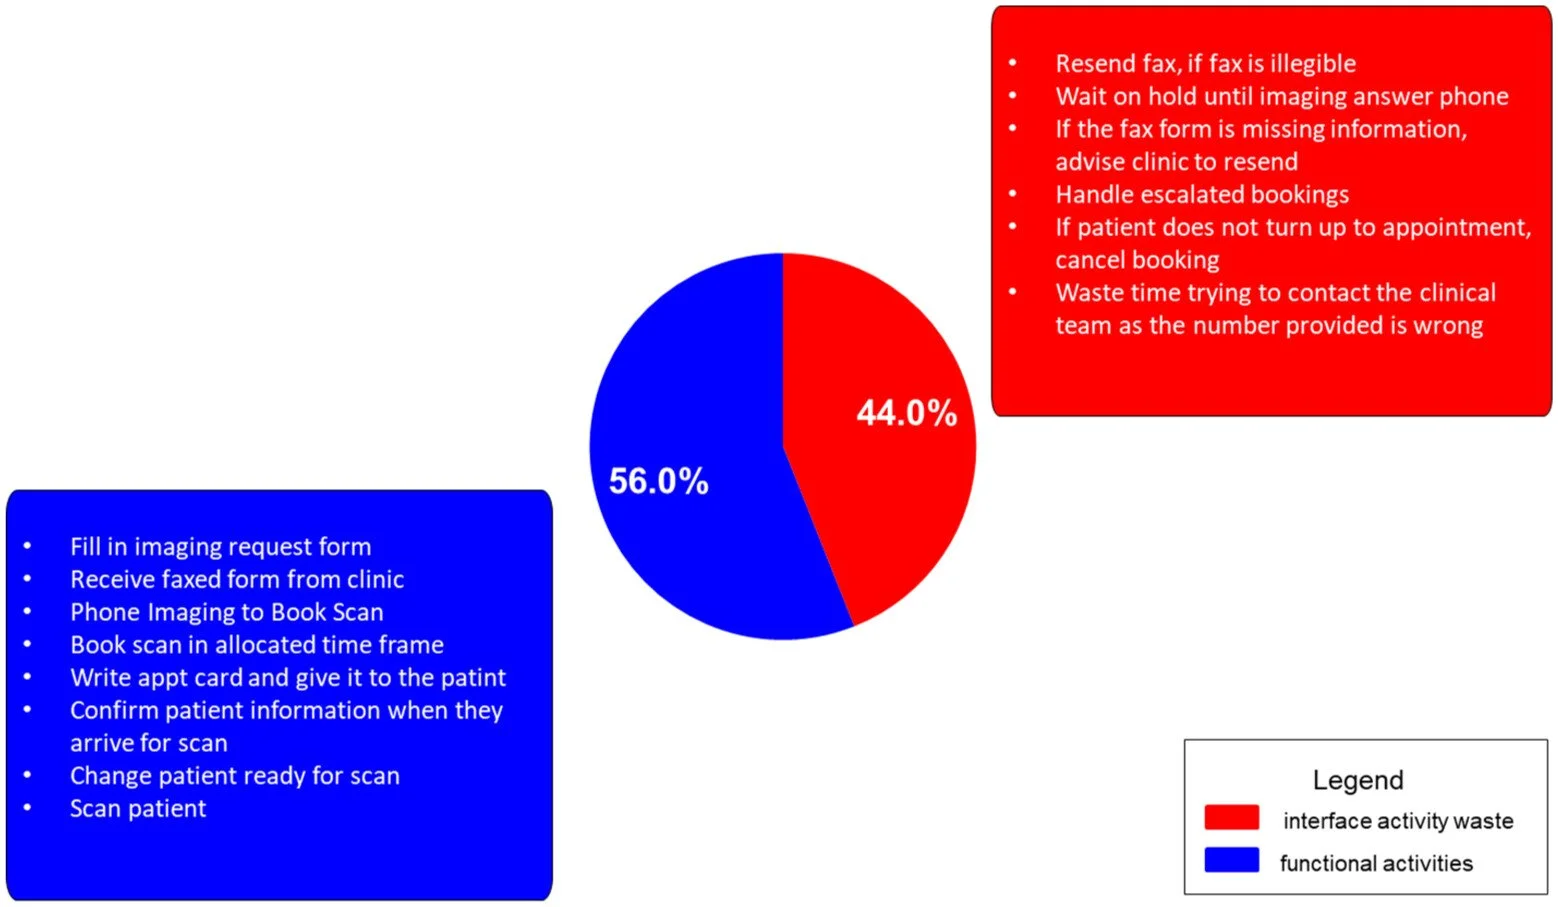
Figure 5. Noise level – Booking Process.
The analysis revealed that doctors were spending 24% of their time (over one day a week) on noise. 42% of the Radiology and Outpatient Administrators’ day was Noise. Nurse coordinators were only able to commit 43% of their time to patient assessment, and the rest of their time was spent responding to calls (10%), scheduling and rescheduling appointments (14%) and a host of other things, mostly noise.
4.2.4 Improve
This phase included: Scenario Model the Future, Generate Ideas, and Plan and Track Change. Scenario Model the Future modelled the impact of potential key changes to free up time (waste) within the process to assess the potential savings. This was followed by ideas generation sessions to develop change ideas. In Plan and Track Change, detailed action plans with clear accountability were created to track, manage and report on progress within the implementation programme. The ideas were generated in workshops with relevant hospital staff in face-to-face discussions in which they could see the waste as identified by 3P analysis and could brainstorm how to reduce it through process improvements.
4.2.5 Control
In the last step, a measures framework is set up to assess adherence to the new way of working and the outcomes. This step serves to achieve managerial control and sustainability of the new ways of working.
This case study serves to illustrate the structure and methods of the 3P intervention-based research in action, including how it was done, and the level of detail involved as well as the outcomes, with this case being one of the 268 in the archival data set we accessed.7 The distinguishing features of 3P deployment of LM can be clearly viewed within this case study, relative to the guiding ‘religious commandments’ expressed by Spearman and Hopp (2021) that we acknowledged in our literature review. These findings from the above case study, and the following larger empirical validation section, lead to a succinct summary of 3P’s distinguishing features and qualities in the later section of this article. 3P at Peter Mac. involved both socio- and technical aspects, being the behavioural aspects of employee involvement in deeply engaging and ‘owning’ the problems and the solutions throughout the engagement process, additional to the technical aspects of what is really an end-to-end ‘process analysis’, that importantly records all the things that employees do, including the noise activities that are otherwise undocumented and therefore cannot be eliminated.
4.3. Empirical validation of 3P model
Using extracted data from the 3P archival databases, we were able to observe the widespread utility of the LM implementation tools. The most relevant benefits are noise reduction (time saved), financial benefits and lead time reduction. By reviewing and understanding the sample projects from the 3P databases and the identified waste, this evidence confirms the benefits via a number of different channels: interviews with relevant clients and key stakeholders, client diagnostic reports and measurements of results for the projects.
The 3P databases were the documented case files of the 268 interventions, containing records of what was done in each intervention (following Figure 1), how each was mapped (as in the hospital case study above), and what were the nature and extent of post-deployment improvements. We found 268 projects in the 3P databases, and 90%, were domestic (Australian) organizations. The international jurisdictions included: Holland, France, Malaysia, Mexico, New Zealand, the UK and the USA. Table 1 lists 17 industry sectors where 3P had been deployed. 82% of the organizations are in the administrative or service sectors as might be expected for a modern developed economy. The 3P approach has been deployed both in blue-collar (see Table 1 for inclusion of construction, logistics, transport and manufacturing) and knowledge worker environments (retail, healthcare, financial services, government) and has detected broadly the same level of waste – the median waste average in Table 1 is 36.1% – that is, 361 full-time equivalents in a 1000-person organization. The three sectors with the greatest number of 3P applications are financial services (60 projects), government (52 projects) and health care (30). These three sectors add up to 142 of 268 projects, which is equivalent to 53% of the total sample. Both the mean and median waste % of each sector were computed and are shown in Table 1.
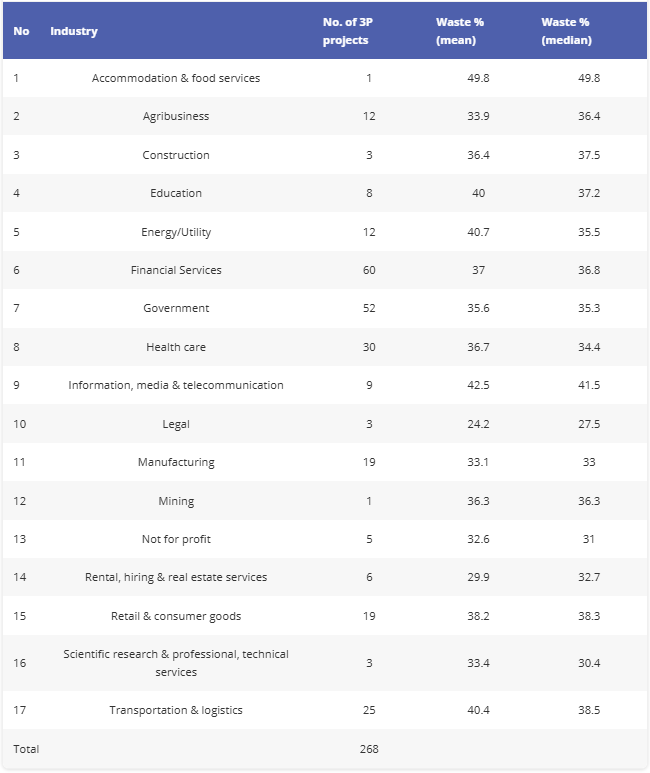
Table 1. A summary of 3P project waste percentage (% total staff time) – mean and median.
To avoid bias due to outliers, we focus on the median waste % column. Figure 6 shows all sectors/projects suffered from significant waste, ranging from 27.5% to 49.8%. In other words, on average, 27.5% to 49.8% of employee time in the 268 projects from 17 sectors were non-value-adding. Specifically, the three sectors that have the highest median waste % are accommodation and food services (49.8%), information media and telecommunication (41.5%) and transportation and logistics (38.5%). Conversely, the three sectors that have the lowest median waste % are legal (27.5%), scientific research and professional, technical services (30.4%) and not for profit (31.0%).
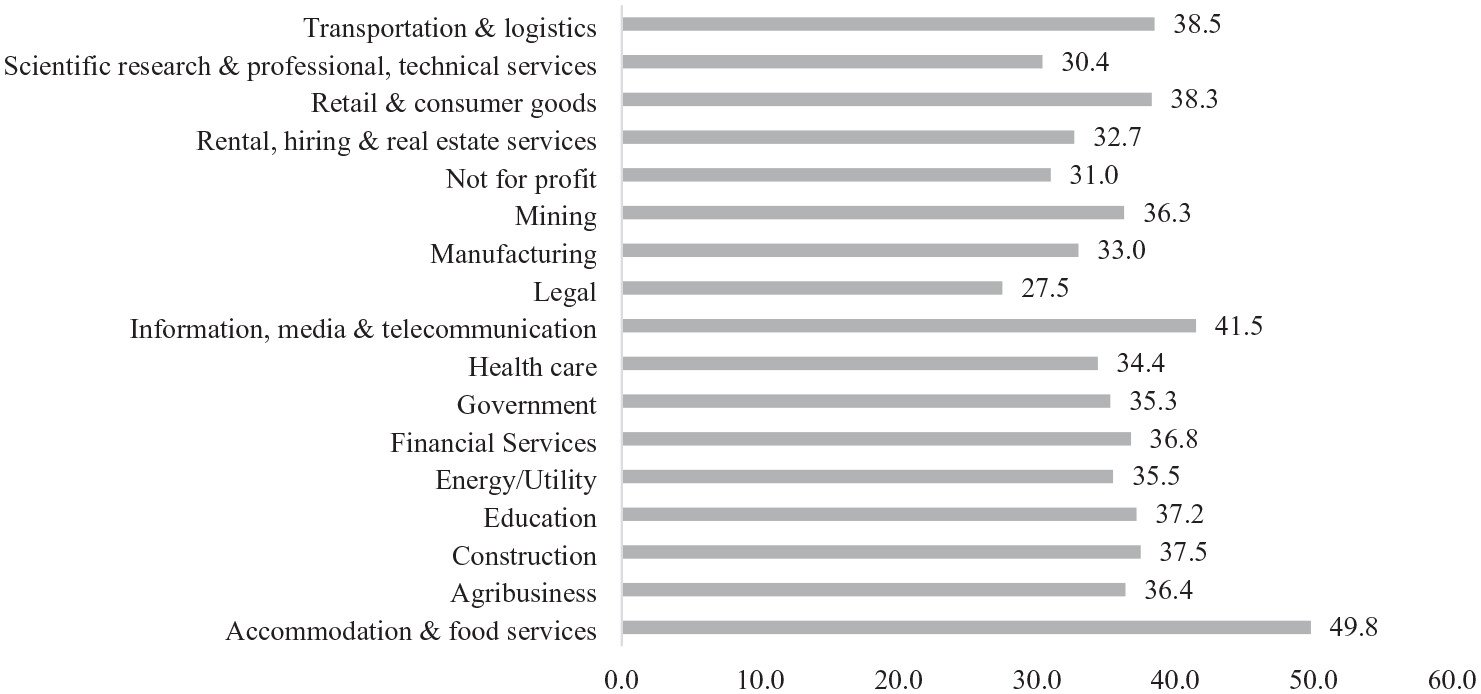
Figure 6. Waste percentage (median) by industry.
4.3.1 Implementation experience
Of 268 projects, 198 (73.9% of projects) implemented the 3P recommended changes and 100% of those that implemented improved their processes. As shown in Table 2, there are 14 sectors that had at least 50% implementation rate, except education (3 of 8 projects implemented, i.e. 37.5%), not for profit (1 of 5 projects implemented, i.e. 20%) and legal (no project implemented). There are four sectors that had 100% implementation rate, including accommodation and food services; construction, mining, and rental; hiring; and real estate services. Typical reasons for non-implementation were that executives became engaged in other strategic priorities, such as restructuring (some triggered by the 3P results), acquisitions or other organizational activities that took precedence, at least for a time, over business process improvement.
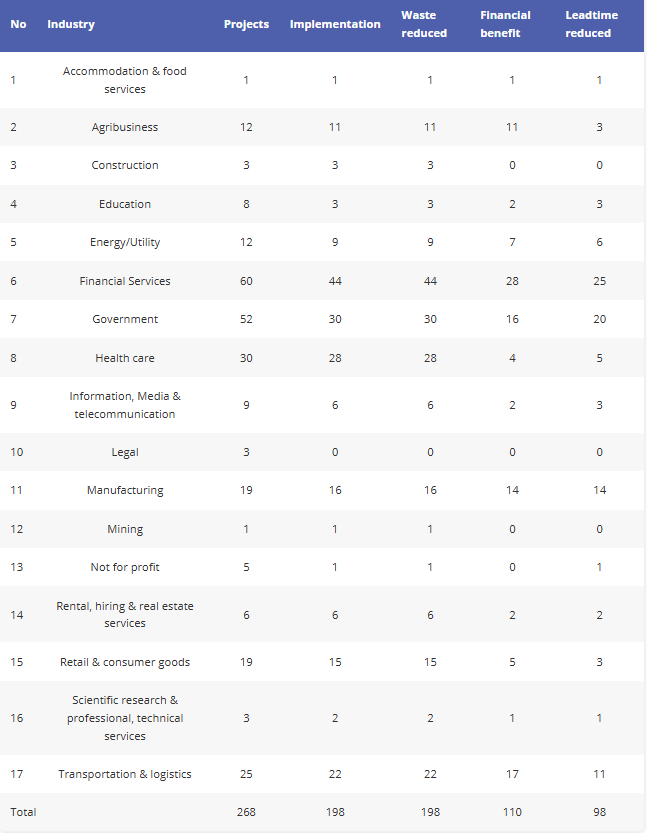
Table 2. A summary of 3P projects and benefits statistics.
To understand the benefits of the implementation, the projects have been reviewed and defined into three types of benefits, being waste reduction, financial benefit (increased revenue or cost reduction) and lead time reduction. Overall, 198 projects achieved at least one benefit. Specifically, of the 198 projects that implemented changes, 100% of these projects achieved a reduction in waste (noise reduction), 110 projects or 55.6% achieved a financial benefit in increased revenue or cost reduction, 98 projects or 49% achieved a reduction in lead time. It can be concluded that the implementation of the 3P model makes a significant contribution to improving important business outcomes.
4.4. Aggregated findings of how 3P addresses the identified LM shortfalls
There is a strong underpinning theory supporting LM approaches to operations management. For example, Schmenner and Swink (1998), updated in Yin et al. (2017), outline the ‘Theory of Swift and Even Flow’ (TSEF), which applies to shop floor materials flow and equally to information flow in knowledge worker environments. There are two primary principles in TSEF including reducing variation and measuring the throughput time:
‘Swift, even flow concentrates its attention on the flow of materials through a process; it asks people to take the viewpoint of the materials moving through a process. By reducing the variation and throughput time of those materials, one eliminates the nonvalue-added aspects of production, which is where the cost and inefficiencies lie’. (Schmenner, 2015: 345).
TSEF maintains that ‘a process becomes more productive as its material and information flows increase in speed and evenness’ (Yin et al., 2017: 68). Within this theory, Schmenner and Swink (1998) described the elements of value-added activity and non-value-added activity. Non-value-adding elements in the knowledge worker workplace are the noise activities.
Narayanan et al. (2022) have recently summarized theories underpinning lean, and we use their core premise here that Lean is principally a sociotechnical set of activities. However, although few previous empirical studies have fully opened the ‘black box’ of Lean to deeply understand how and why it often doesn’t work to deliver improvements, we have done so by taking Lean apart, changing how it is deployed from traditional top-down approaches, to a detailed and more atomistic ‘bottom-up’ method, then reassembled it and deployed it as an approach to sociotechnical that fully integrates job roles, process steps and analysis, waste reduction and behavioural change. The 3P approach described, deployed (268 times) and validated in this study is entirely consistent with Narayanan et al. (2022) in inclusion of employee involvement and psychological safety as foundations for Lean success, building on the theories that they cite. The present study is unique in that it reports on a large number of cases of Lean deployment where true and fully integrated sociotechnical elements were designed and built into the approach.
In summary, the features that this study identified which address the gaps identified in section 2 are:
First, 3P provides the essential data to make the end-to-end waste (the Muda) evident to all and addressable. It provides detailed activity data at an atomistic level for each team. Each instance of noise activity can therefore be viewed by structure (vertically) and by process (horizontally). Similarly, the causal activities, which are immediately visible in the end-to-end process (horizontal) view, can also be viewed by structure. This means that the accountability for the activities which give rise to each element of waste is indisputable.
Second, 3P truly engages staff and their immediate management. It provides training and guidance to each employee to enable them to document everything they do including the noise activities. It therefore truly engages the employees of every organizational level in locating and quantifying waste. This waste is then evident to higher levels of management. The clear identification of the waste usually overcomes the ‘lack of commitment from top managers’ referred to in section 2. Third, 3P generates practical, implementable change proposals. Noise elimination change needs are developed by the employees suffering from them and those generating them so solutions can be quickly agreed and implemented. Fourth, 3P presents the data, including the identified noise in end-to-end processes which provides the platform to deliver strategically important outcomes. The main drivers of waste are identified, quantified and priorities can therefore be set by management for the proposed changes. Some noise drivers will merely improve responsiveness and productivity, albeit important strategic goals. Others, which can be given a higher priority, will directly address key strategic goals such as raising customer service or increasing asset utilization. The BCI measures then become the deployment of an organization’s strategic goals for each team. Fifth, 3P locks change in. Measures (BCIs) confirm that all fix activities continue to be routinely carried out making the changes permanent because they are agreed and accepted by each person/team/manager/business.
It is therefore argued that 3P delivers the system envisaged ‘an integrated socio-technical system whose main objective is to eliminate waste by concurrently reducing or minimizing supplier, customer, and internal variability’ (Shah and Ward, 2007).
5. Discussions: direct comparison with traditional application of LM
This section brings together from the intervention-based work, the archival analysis, the interviews with 3P developers and the post-analysis workshops, the findings that express precisely why traditional LM has had deployment problems, that 3P was designed and used to overcome. These multiple methods and data from them converged to create a distinct LM approach that was continually refined over decades, containing the distinctive features as shown in Table 3. Over three decades of its development, 3P has been refined to expand its capacity to undertake large processes with many thousands of activities, efficiently identify concentrations of waste, and through the use of user-friendly systems, improve its efficacy and applicability. The ‘behavioural change indicators’ feature was developed in 2008 and is defined and referred to in Table 3: they are the part of 3P that measures compliance with deployed process changes.
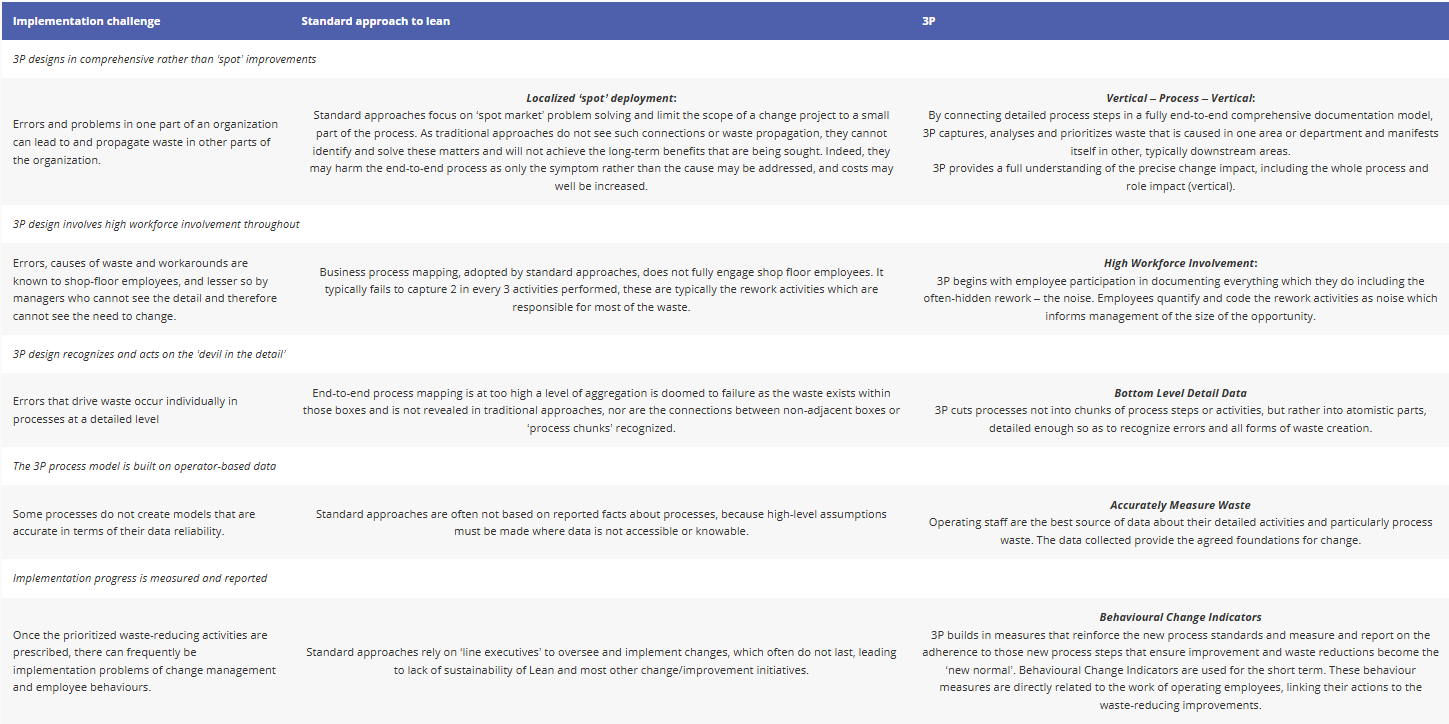
Table 3. 3P compared with standard approaches to Lean.
In Table 3, we have summarized the key features of 3P and how it overcomes the traditional barriers to successful implementation of LM. Table 3 shows how the 3P approach delivers a comprehensive, end-to-end process LM deployment that is distinct from standard approaches in the five key ways that we have thoroughly validated.
The 3P approach as detailed by our illustrative case study, and empirically supported by the evidence from the archival data analysis, shows that when LM is effectively implemented, it can be efficient and lead to sustainable improvements. The efficiency of 3P interventions comes from the use of shop floor operating staff to provide the detailed data about their roles and activities, that can then be efficiently and effectively coded, analyzed and then used to identify systemic improvements that reduce noise/waste, and improve flow and first time through rates on items being processed. This is in strict accordance with the Theoretical frame of the Swift and Even Flow principle that we referred to in framing our work. The sustainability of the improvements achieved by 3P interventions is supported by the employee involvement and ownership built into the style of the change process but is also reinforced by managers keeping track of benefits that are won through the design and implementation of the Behavioural Change Indicators (BCIs). Examples of BCI measures are compliance to a newly redesigned process or activity, such as recording a sales call outcome, an equipment repair activity, or a rework process.
6. Concluding remarks
This article was set out to understand in depth the 3P approach, analyze its strengths and contrast it with a traditional deployment of LM. The literature reviews of LM promise large gains in productivity, responsiveness, quality and cost. The scholarship further revealed that the typical deployment delivers only limited, tactically focused, transitory, localized improvements – not the desired strategically focused, end-to-end business process optimization. Further analysis of the literature highlighted the failures which inevitably lead to ‘spot’ implementations. The most critical of these was the failure to create a business-wide sociotechnical system which fully engages the organization’s staff and management in end-to-end process analysis and solution deployment. The LM paradox, referred to by Soliman and Saurin (2022) as the gap between ‘lean as imagined’ and ‘lean as done’ clearly explicates the deployment element of the paradox, that 3P has capably closed, through its addressing of the organization’s sociotechnical requirements, being well beyond deploying lean as only a set of tools. Our study demonstrates the five key elements of the deployment shortfalls of traditional LM deployments (Table 3) and presents evidence that allay the criticisms of many previous studies such as Spearman and Hopp (2021) and Hopp (2018), that have indeed identified LM’s implementation problems, but not solved them, as done herein.
6.1. Practical implications
Managerial implications become clear from this study and its findings, namely that to increase the likelihood of succeeding in a Lean deployment, employee involvement is a first key step, and detailed identification of waste sources is necessary, involving a holistic set of connections of these steps, in a process map that is fully detailed enough to ‘see’ this waste, then allow for it to be analyzed, and subsequently reduced through process improvements. Combining job/role redesign with process improvement leads to clarity of the new tasks assignments in the workforce. To achieve sustainability of the improvements, measurement of new process adherence is key. A novel feature of the approach is that it consistently adheres to LM principles itself. It is fast, it truly engages the staff and management in the five LM stages, it creates as it is deployed the desired sociotechnical system and it delivers strategically focused results, quickly and economically.
As a starting point, employees can be invited to communicate their process ‘pain points’ whereby they recognize process waste, of their time and other resources, then can be supported to identify and deploy solutions. While such a purely bottom-up approach may not lead to a comprehensive end-to-end solution, it is likely to be conducive to generate employee involvement and trust when a more comprehensive improvement intervention is applied.
6.2. Limitations
Our research interventions with organizations and our data set came primarily from Australia and should be replicated in other parts of the world where underlying business culture and sociotechnical norms are different. Further, our data set under-represents the not-for-profit sector, where LM can be useful. Finally, our interventions were conducted by LM experts and ultimately need to be tested in a wider range of contexts and circumstances. A further limitation is the relatively small number of deployments in some sectors indicated in Tables 1 and 2 and Figure 6, which indicates that there might be significant standard error around these reported averages.
6.3. Further research
Further research is warranted to continue to refine our understanding of the key mechanisms of Lean and its deployment. While the 3P approach reported herein shows significant progress in success rates of such deployment, replication is warranted in different national cultures, sectors of the economy, and indeed in different circumstances of technology intensity of firms and economic development in firms’ context. For example, how do the five distinguishing features of 3P (Table 3) that generally worked well in our study need to be adapted in public sector agencies, educational institutions and other forms of not-for-profit organizations? Further, longer-term longitudinal studies are needed to trace the sustainability of methods such as 3P. Further research is potentially valuable that takes or adapts the key findings from this study to other domains of organizational change, for example, in contexts that are not process oriented, such as culture change. The paradox that is articulated in this study can be used as a launching pad for further research that may cast insights into elements of paradox theory more generally and in other contexts (Lewis and Smith, 2022). Finally, we suggest that further research is warranted to examine how Lean deployment approaches such as 3P and its future variants are best applied in organizational settings that are not primarily or solely focused on creating a financial surplus, such as those that focus primarily on achieving social or environmental progress.
Acknowledgments
The authors would like to thank Morgan Swink and Srinivas Talluri for their comments on the previous versions of this article.
Read the original article posted here